
Clinical validation of a ctDNA-based assay for multi-cancer detection: A Vietnamese longitudinal prospective cohort study of 2795 participants
Authors
BACKGROUND
- Multi-cancer early detection has the potential to enhance cancer detection and decrease cancer mortality rates.
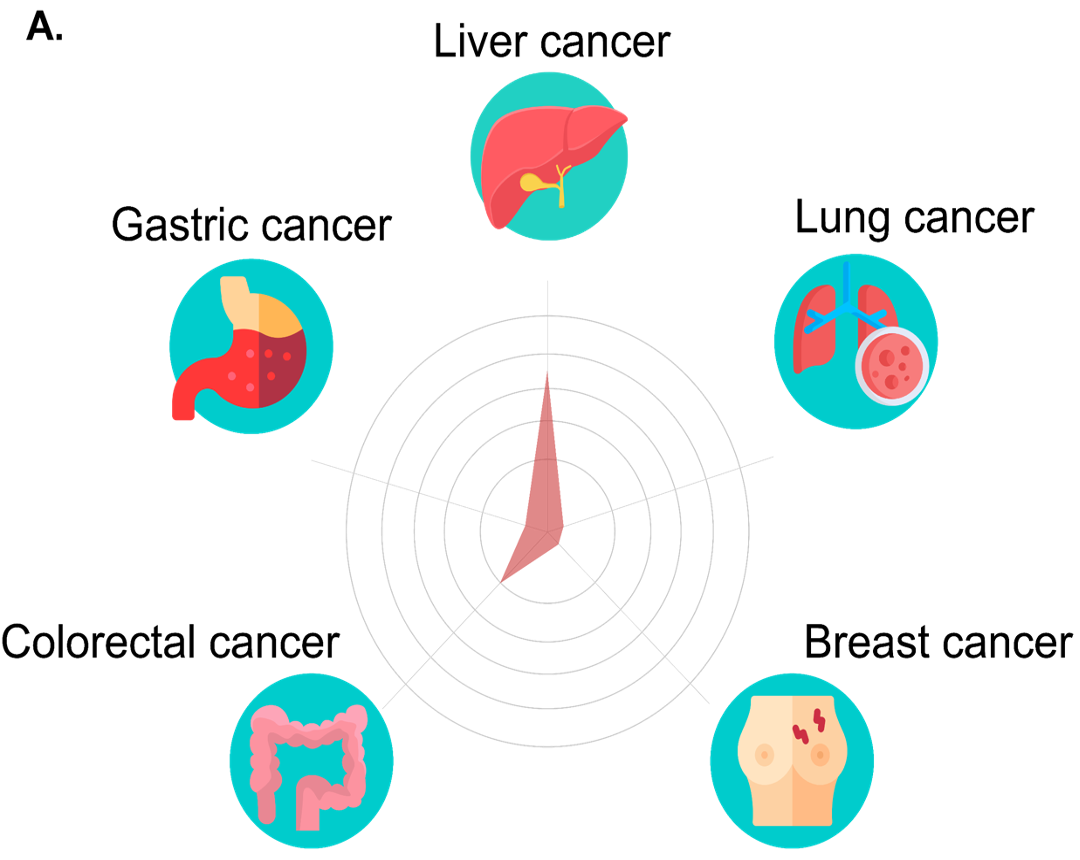
- We developed a multimodal liquid biopsy (LB) assay named SPOT-MAS to detect the five most prevalent types of cancer in Vietnam (liver, breast, colorectal, gastric, and lung cancer).
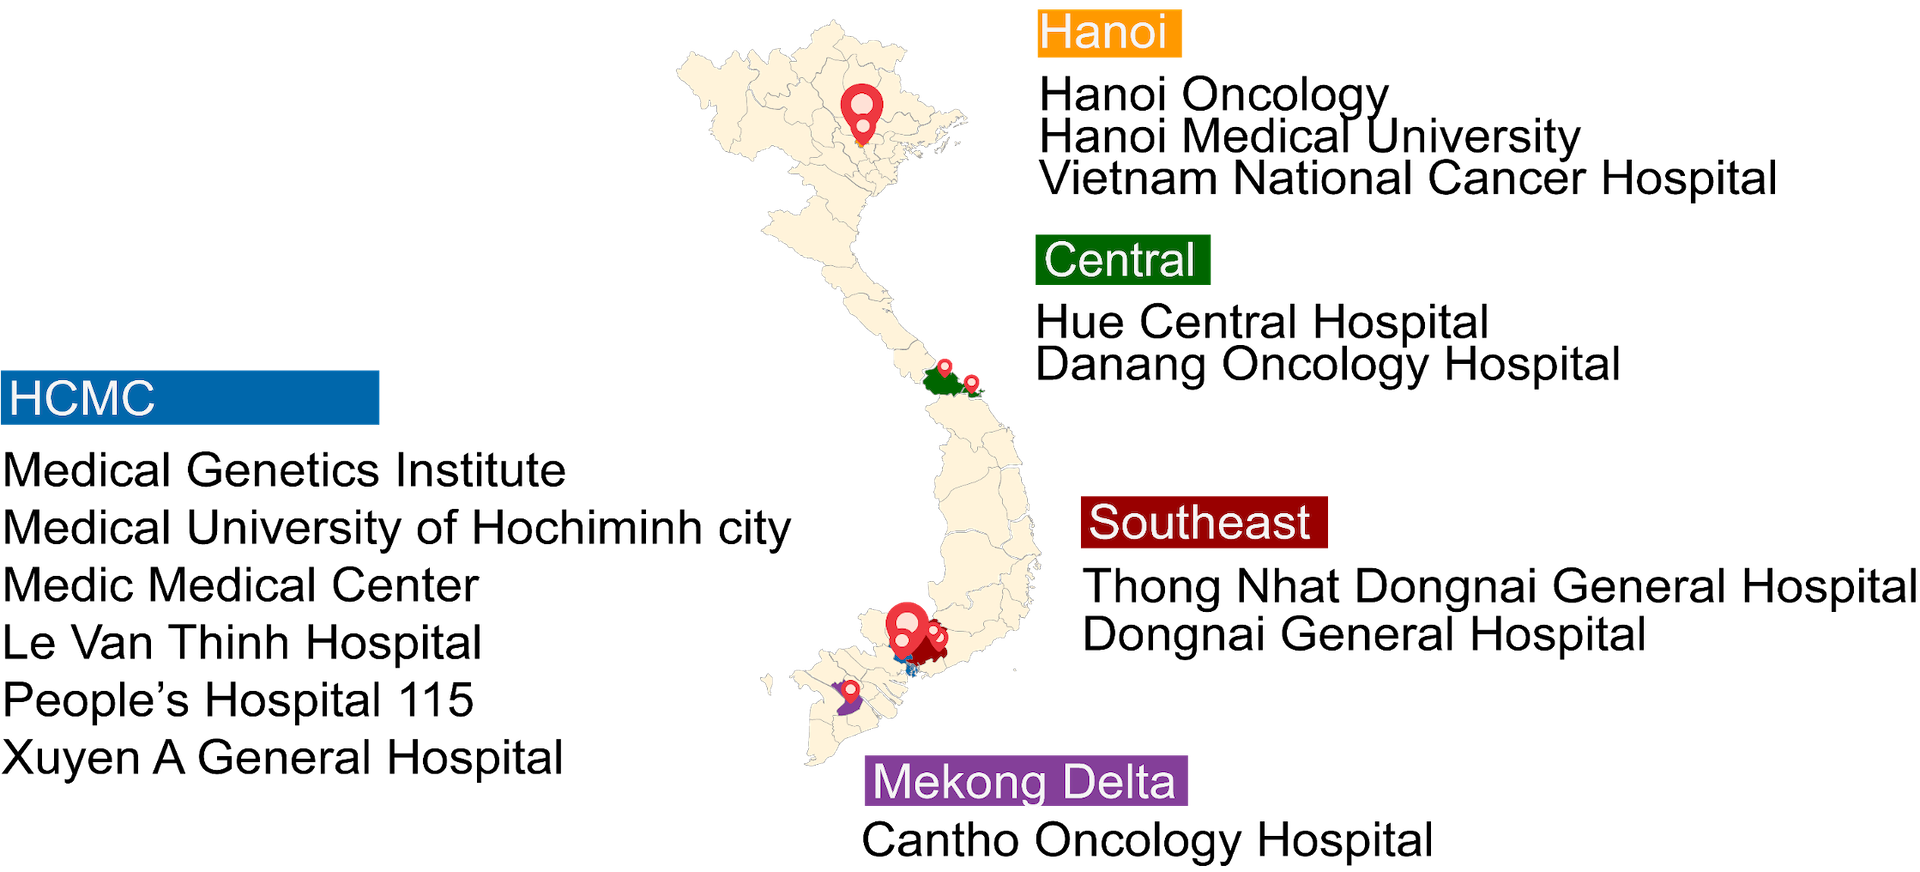
- This clinical trial study (K-DETEK) aimed to assess the feasibility and performance of SPOT-MAS in 2,795 asymptomatic individuals recruited from from 13 sites across Vietnam.
STUDY DESIGN
- K-DETEK (NCT05227261) is a prospective multi-center study recruiting participants who attended periodic follow-up visits for their chronic conditions or annual health check-ups at 13 hospitals across Vietnam beginning in April 2022.
- All 2795 participants aged 40 or older and had unknown cancer status.
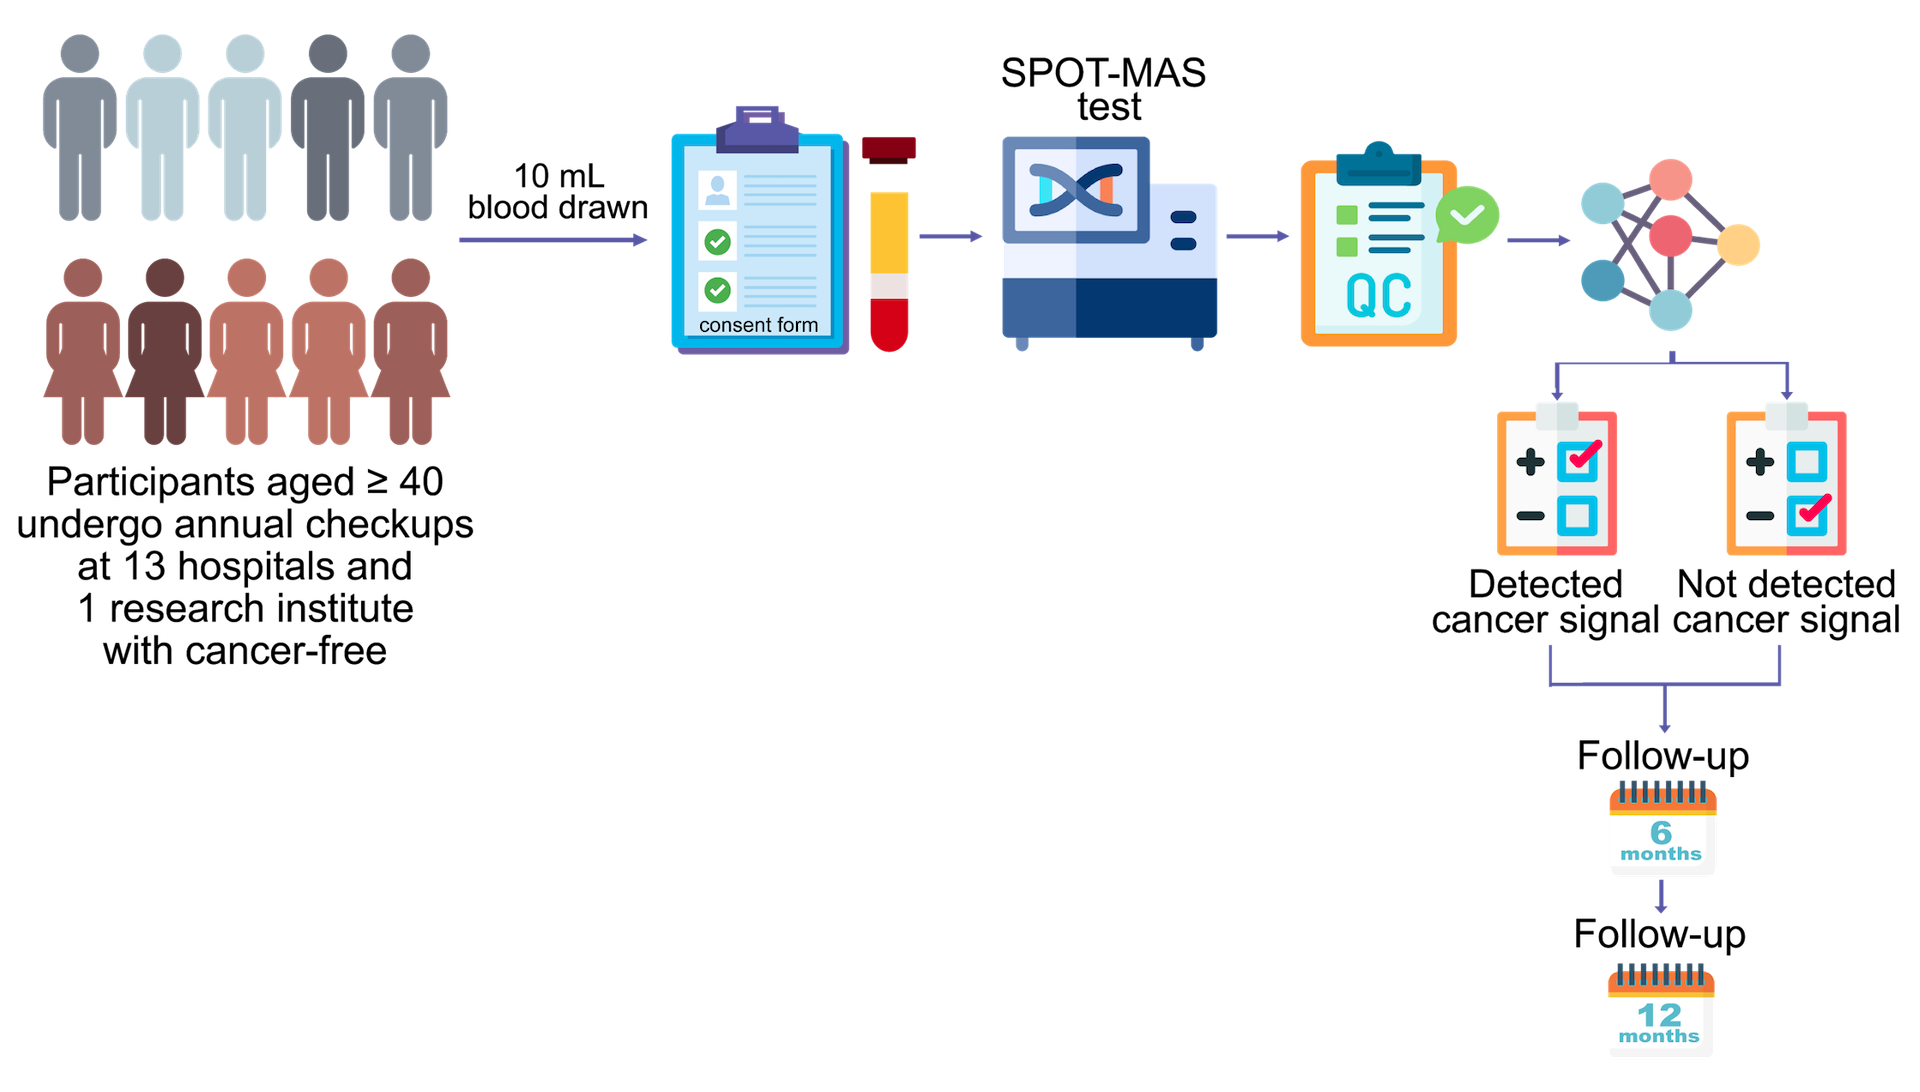
Primary outcome
- Positive predictive value
- Negative predictive value of the blood ctDNA test in early detecting cancers
Secondary outcome
- Accuracy of the test in detecting tumor location
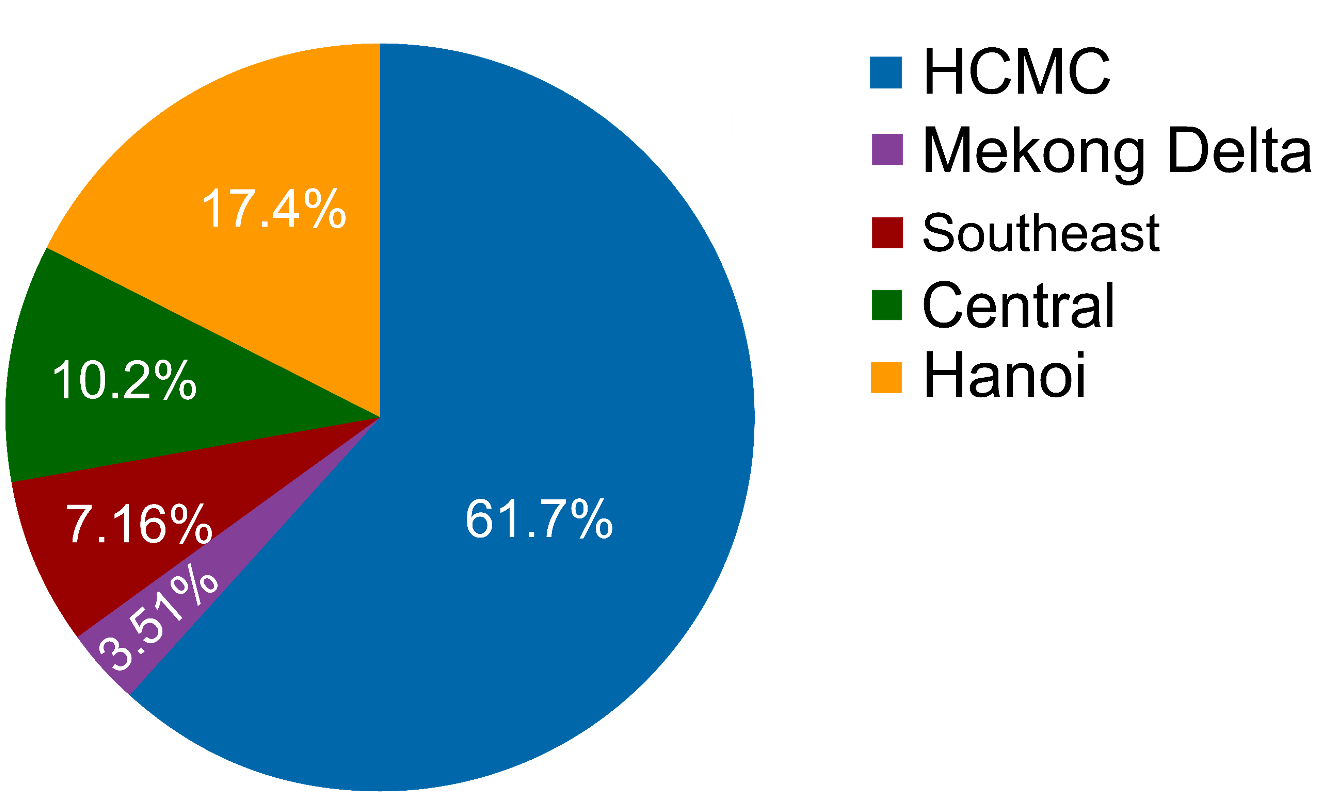
PARTICIPANT DEMOGRAPHICS
Associations between clinical features and cfDNA levels
| Clinical features | cfDNA amount (ng) per ml plasma | ||||
|---|---|---|---|---|---|
| N = 2795 | Median | IQR | Range | p-value* | |
| Age | |||||
| <51 | 1428 | 3.3 | 2.4-4.5 | 0.6-39 | 2.239E-20 |
| ≥51 | 1367 | 3.9 | 2.7-5.7 | 0.6-52.9 | |
| Gender | |||||
| Female | 1615 | 3.3 | 2.4-4.8 | 0.6-51.9 | 1.653E-10 |
| Male | 1180 | 3.9 | 2.7-5.4 | 1.2-39 | |
| Liver hepatitis | |||||
| Yes | 404 | 3.9 | 3-5.4 | 1.2-24.6 | 2.486E-07 |
| No | 2391 | 3.6 | 2.4-5.1 | 0.6-51.9 | |
| Alcohol consumptions | |||||
| Yes | 539 | 3.9 | 1.2-22.5 | 1.2-24.6 | 0.07807 |
| No | 2256 | 3.6 | 2.4-5.1 | 0.6-51.9 | |
| Smoking | |||||
| Yes | 385 | 3.9 | 1.2-22.5 | 1.2-24.6 | 0.1004 |
| No | 2410 | 3.6 | 2.4-5.1 | 0.6-51.9 | |
| High risk factors | |||||
| Yes | 887 | 3.9 | 3-5.4 | 0.6-51.9 | 1.552E-12 |
| No | 1908 | 3.6 | 2.4-4.8 | 0.6-39 | |
(*)p-values were calculated by a two-sided Mann-Whitney-Wilcoxon test with Bonferroni correction
SPOT-MAS TEST PERFORMANCE
| N = 2795 | |||||
|---|---|---|---|---|---|
| ctDNA signal detection | |||||
| Detected - n (%) | 13 (0.47%) | ||||
| True positive | 6 (0.21%) | ||||
| False positive | 4 (0.14%) | ||||
| False negative | 3 (0.11%) | ||||
| No current diagnostic resolution | 3 (0.11%) | ||||
| Not detected | 2782 (99.5%) | ||||
| PPV for Cancer Signal Detection | 60% | ||||
| NPV for Cancer Signal Detection | 99.89% | ||||
| Tumor origin prediction accuracy | 83.3% | ||||
CASE STUDY
SPOT-MAS could achieve early cancer detection and provide the opportunity for early treatment.
- 1. Blood sampling for SPOT-MAS test
- 2. ctDNA+ Tissue-of-origin: Liver
- 3. Ultrasound scans Diagnosis of liver tumor
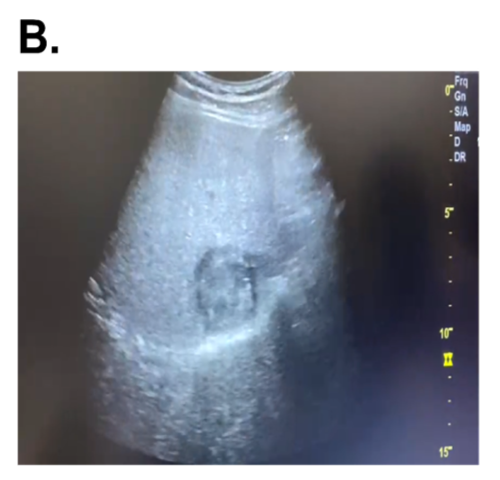
- 4. CT scan Diagnosis of HCC
CT scan result: Fatty Liver Tumor located within the right segment VIII liver Suspected HCC
CONCLUSIONS
- SPOT-MAS detects cancer in asymptomatic participants in early stages when they may benefit from early treatment, with PPV of 60% and NPV of 99.89%.
- SPOT-MAS predicts the tumor location with an accuracy of 83.3%, allowing clinicians to fast-track the follow-up diagnostic and guide any necessary treatment.
FUTURE DIRECTION
We are conducting an extended K-DETEK study recruiting 10,000 additional participants to
- Further validate the performance of SPOT-MAS in a larger cohort.
- Evaluate participants’ attitude toward cancer screening.
- Evaluate cost-effectiveness and clinical benefit.